⚠️ Beta. Active development; treat every release as a release candidate. Browse releases →
DrainCtl

Someone disabled new connections
at 2 AM. You'll know who.

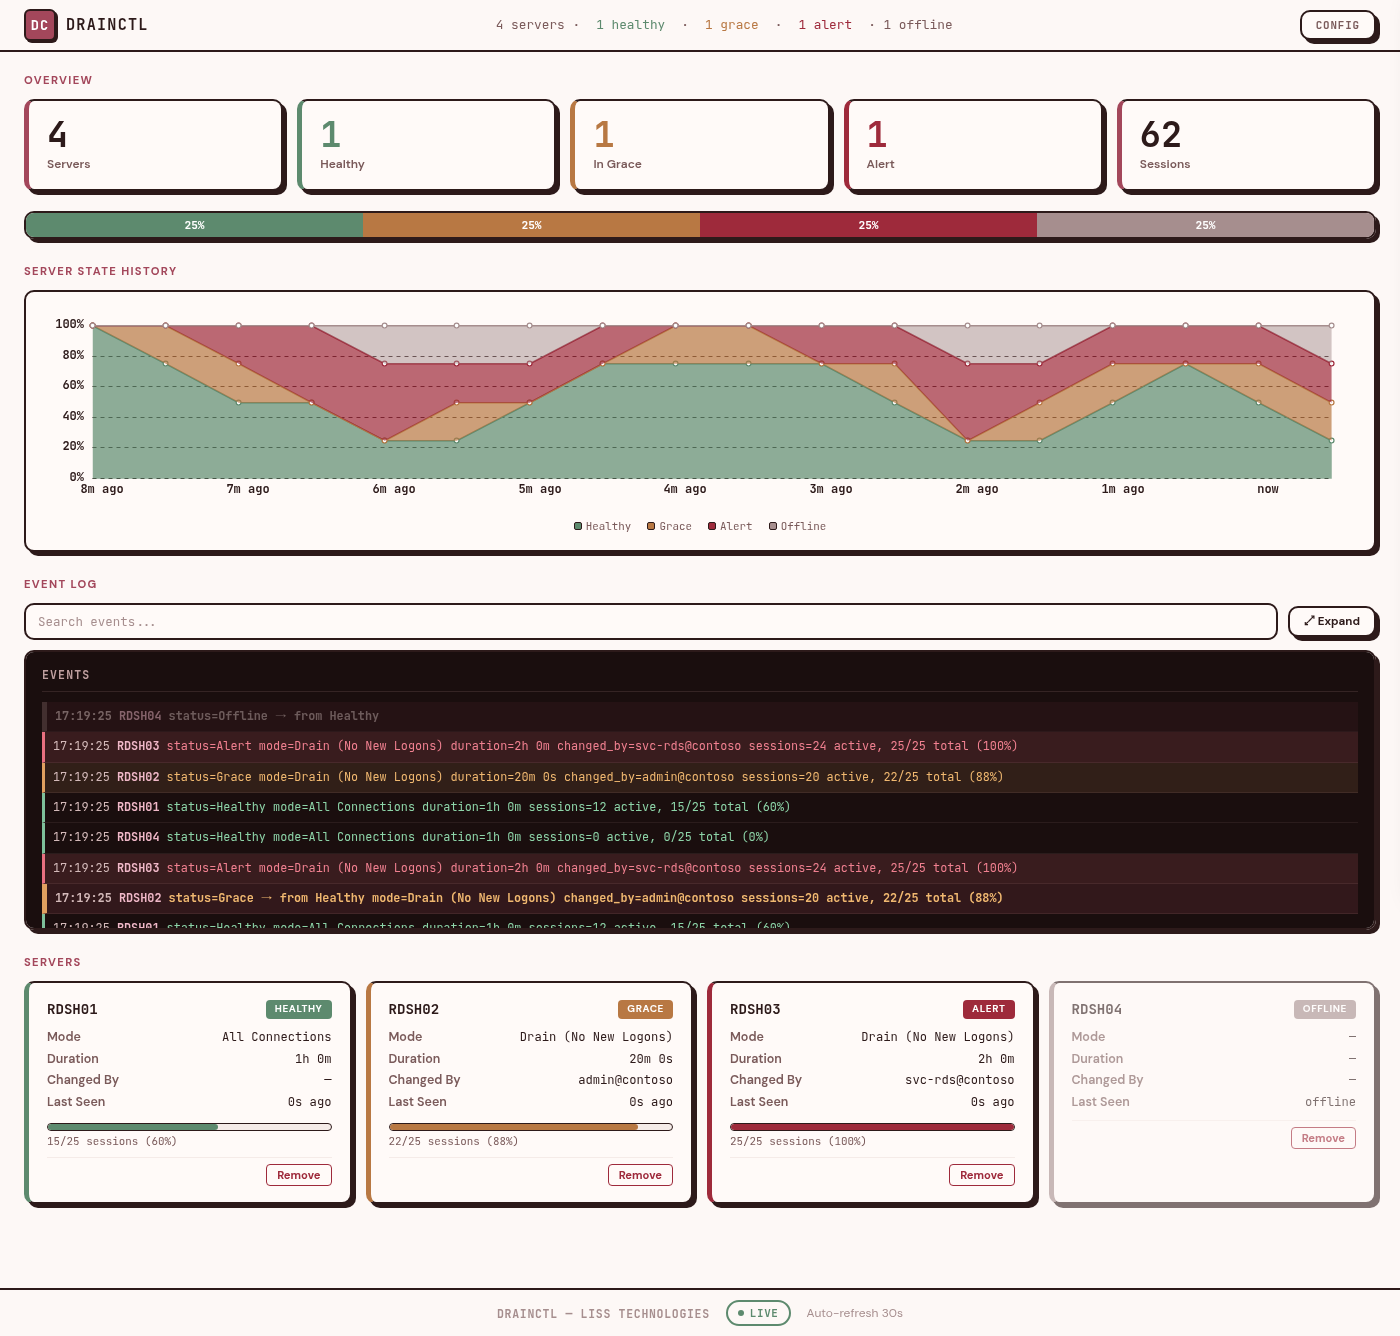
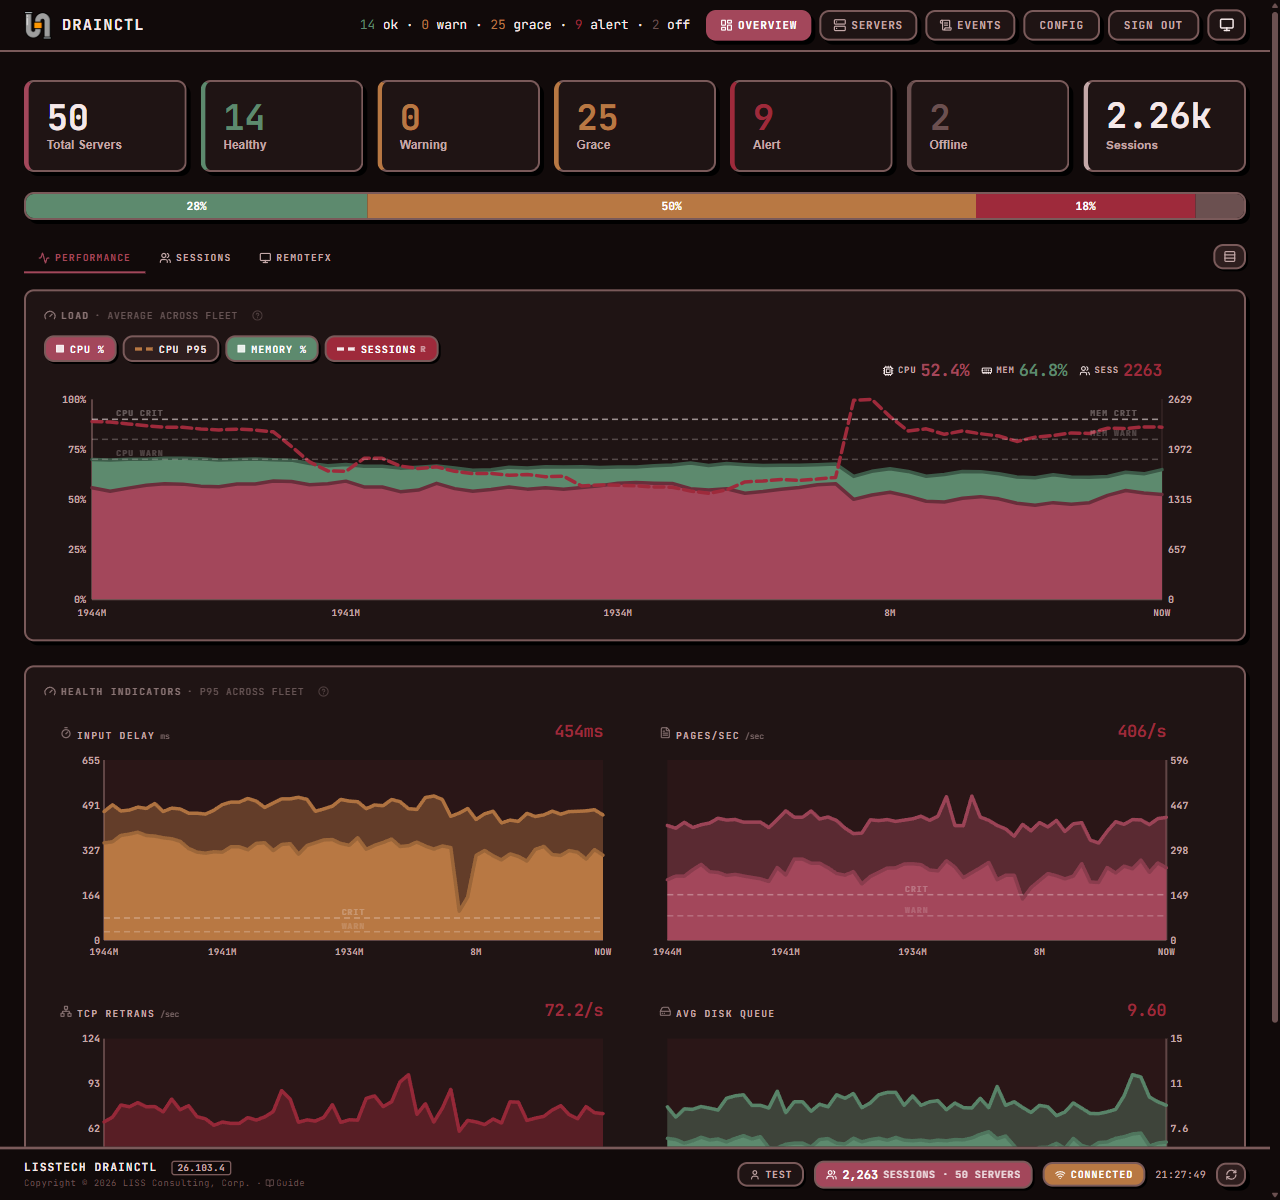
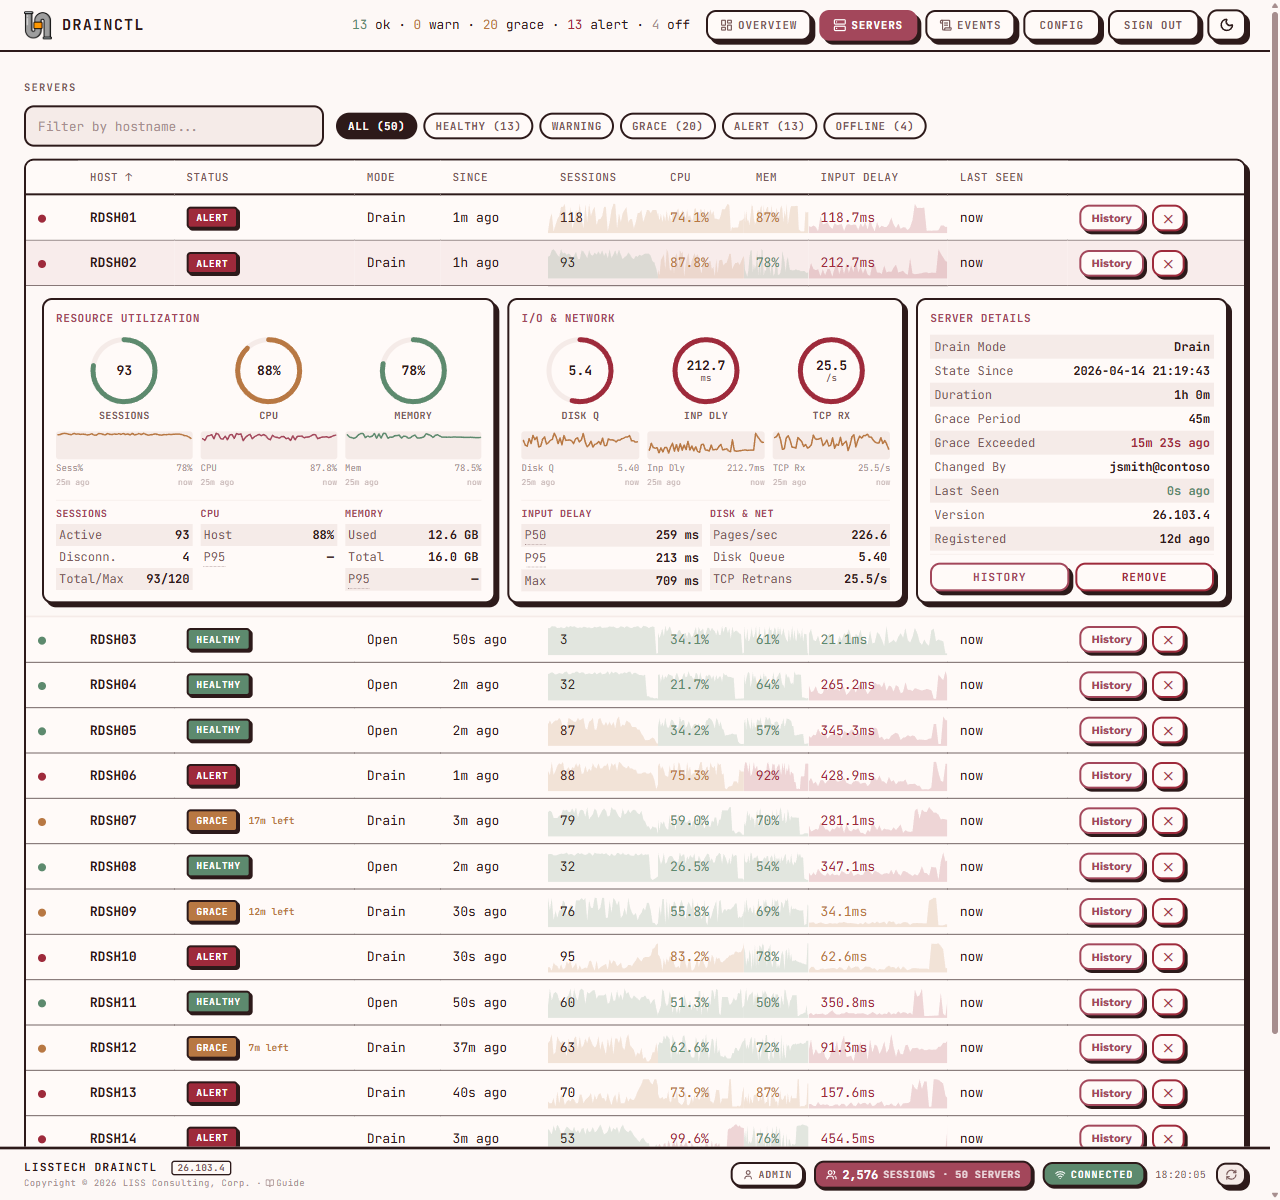
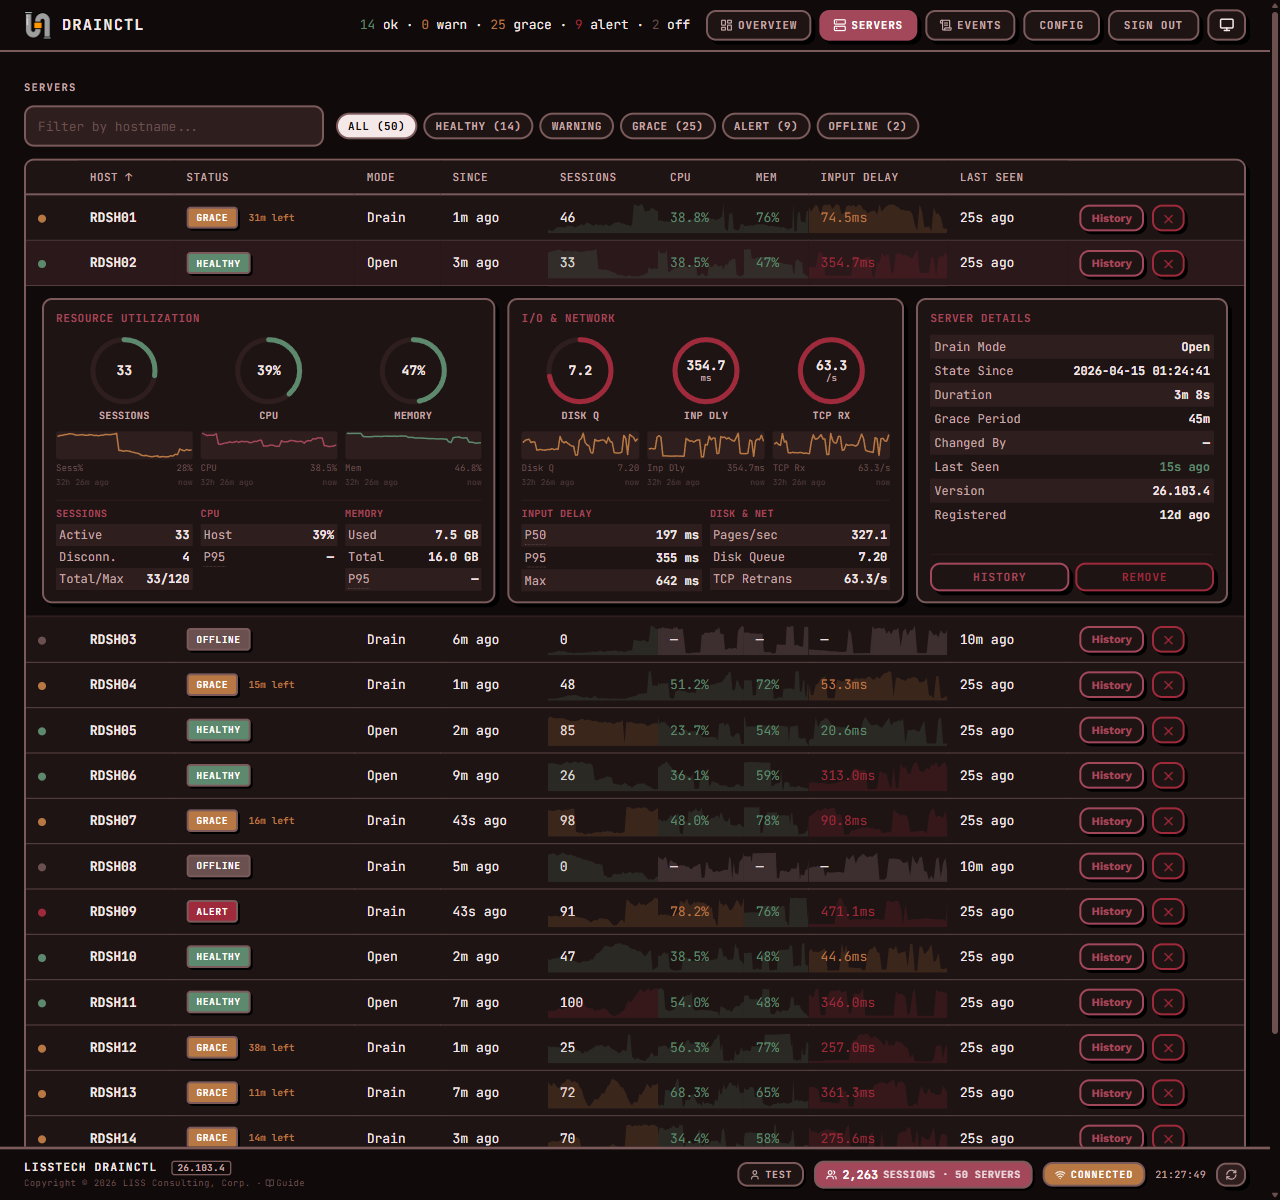
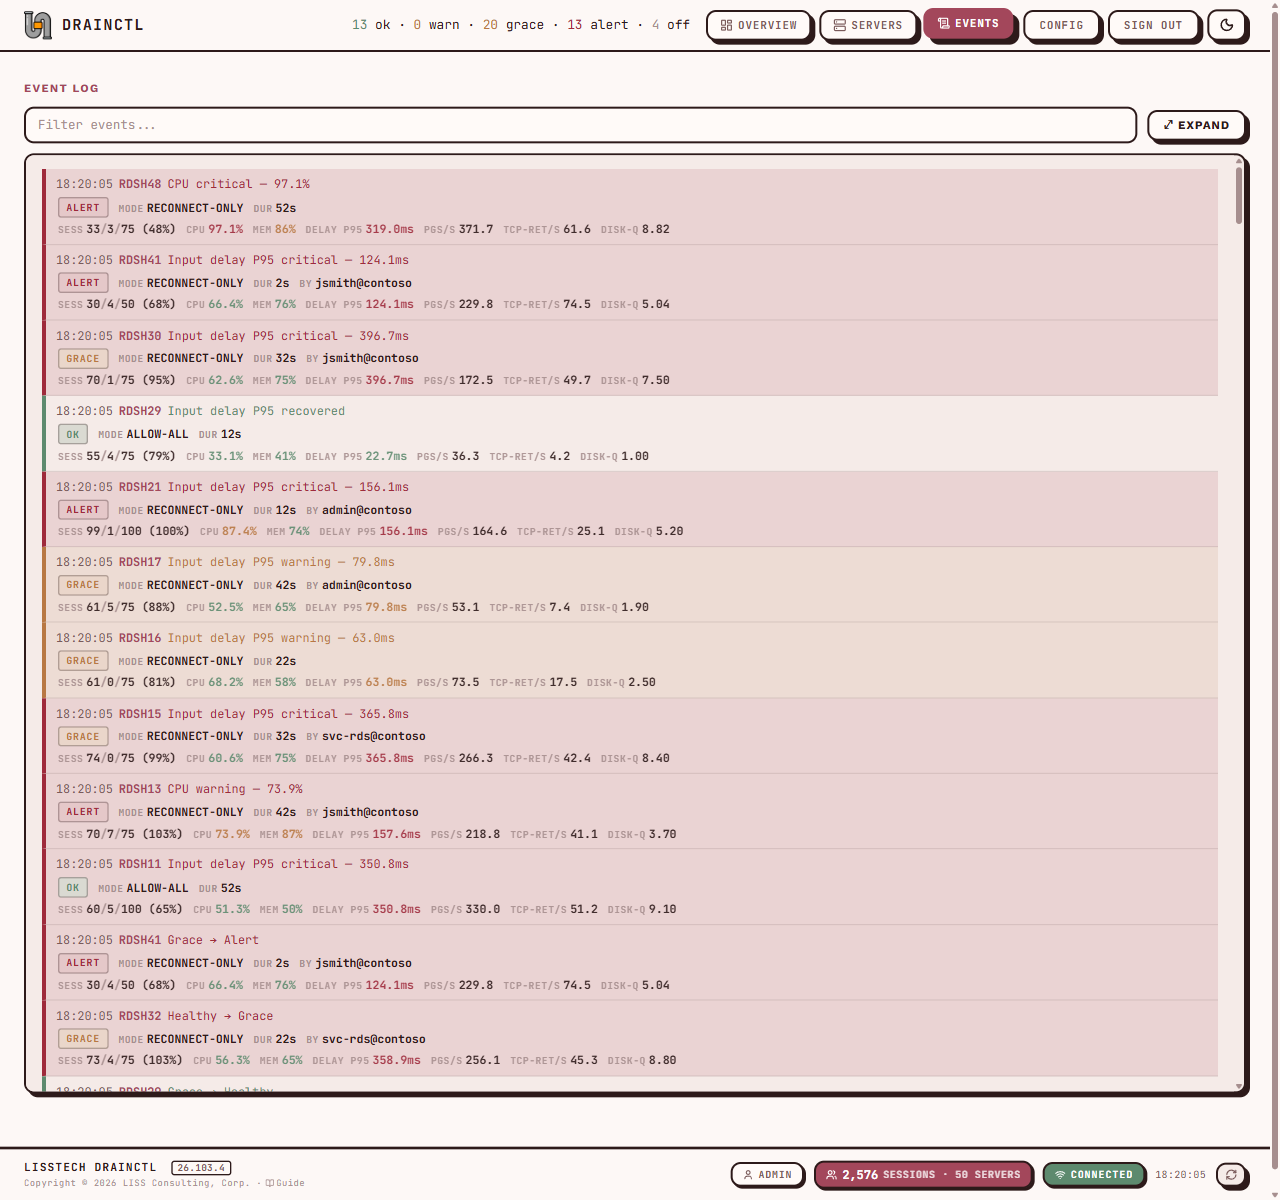
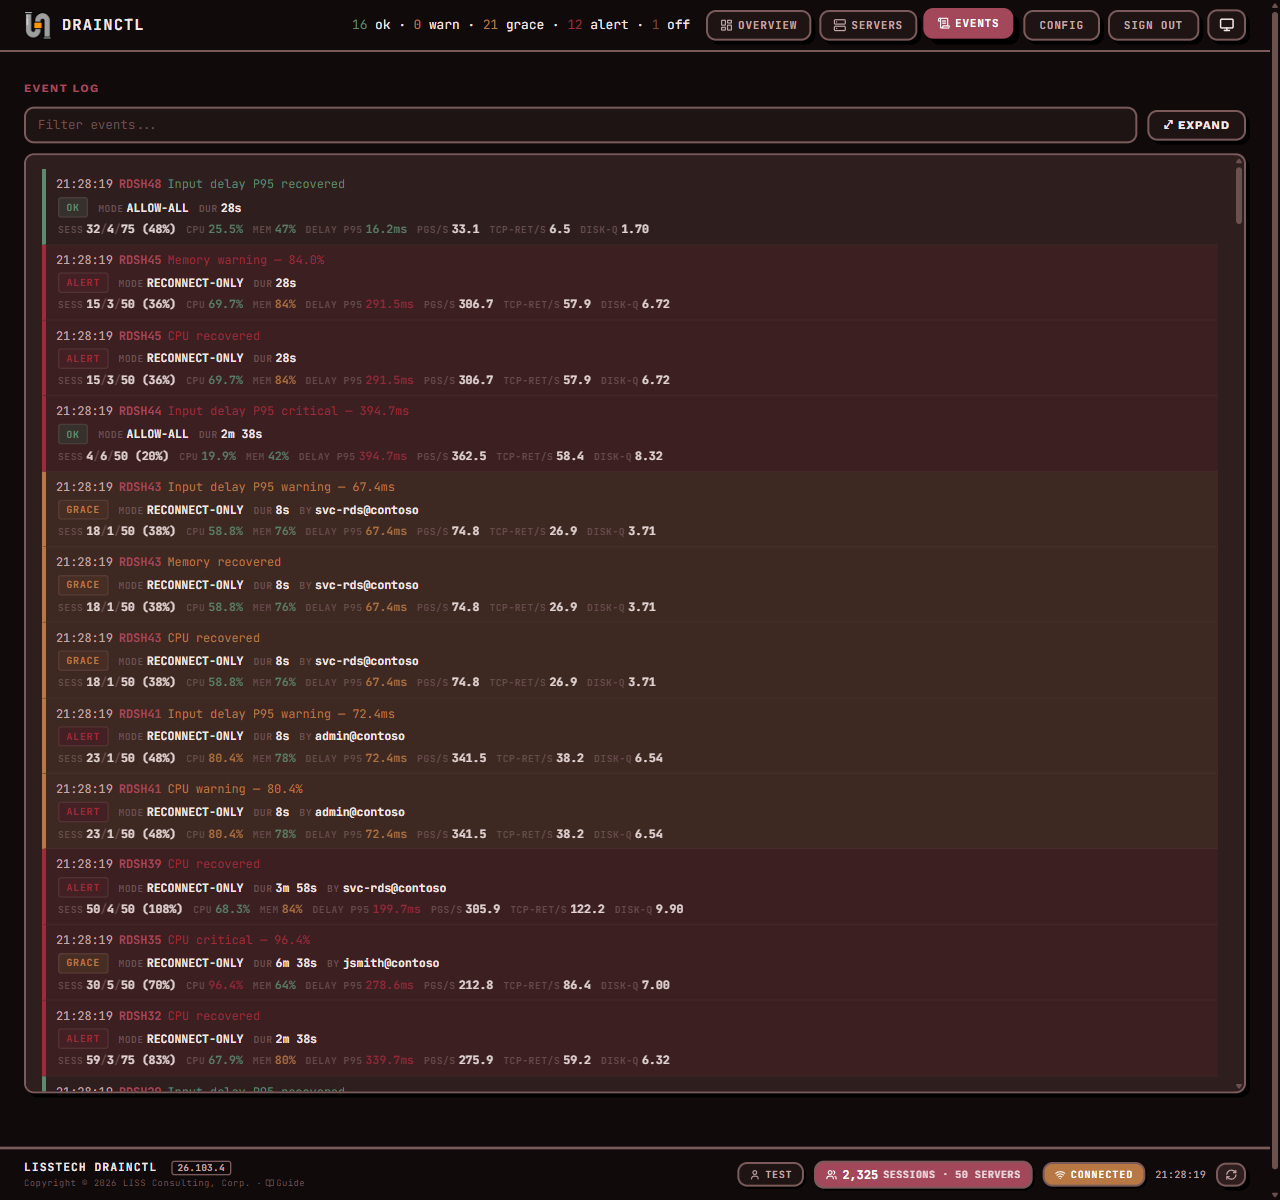
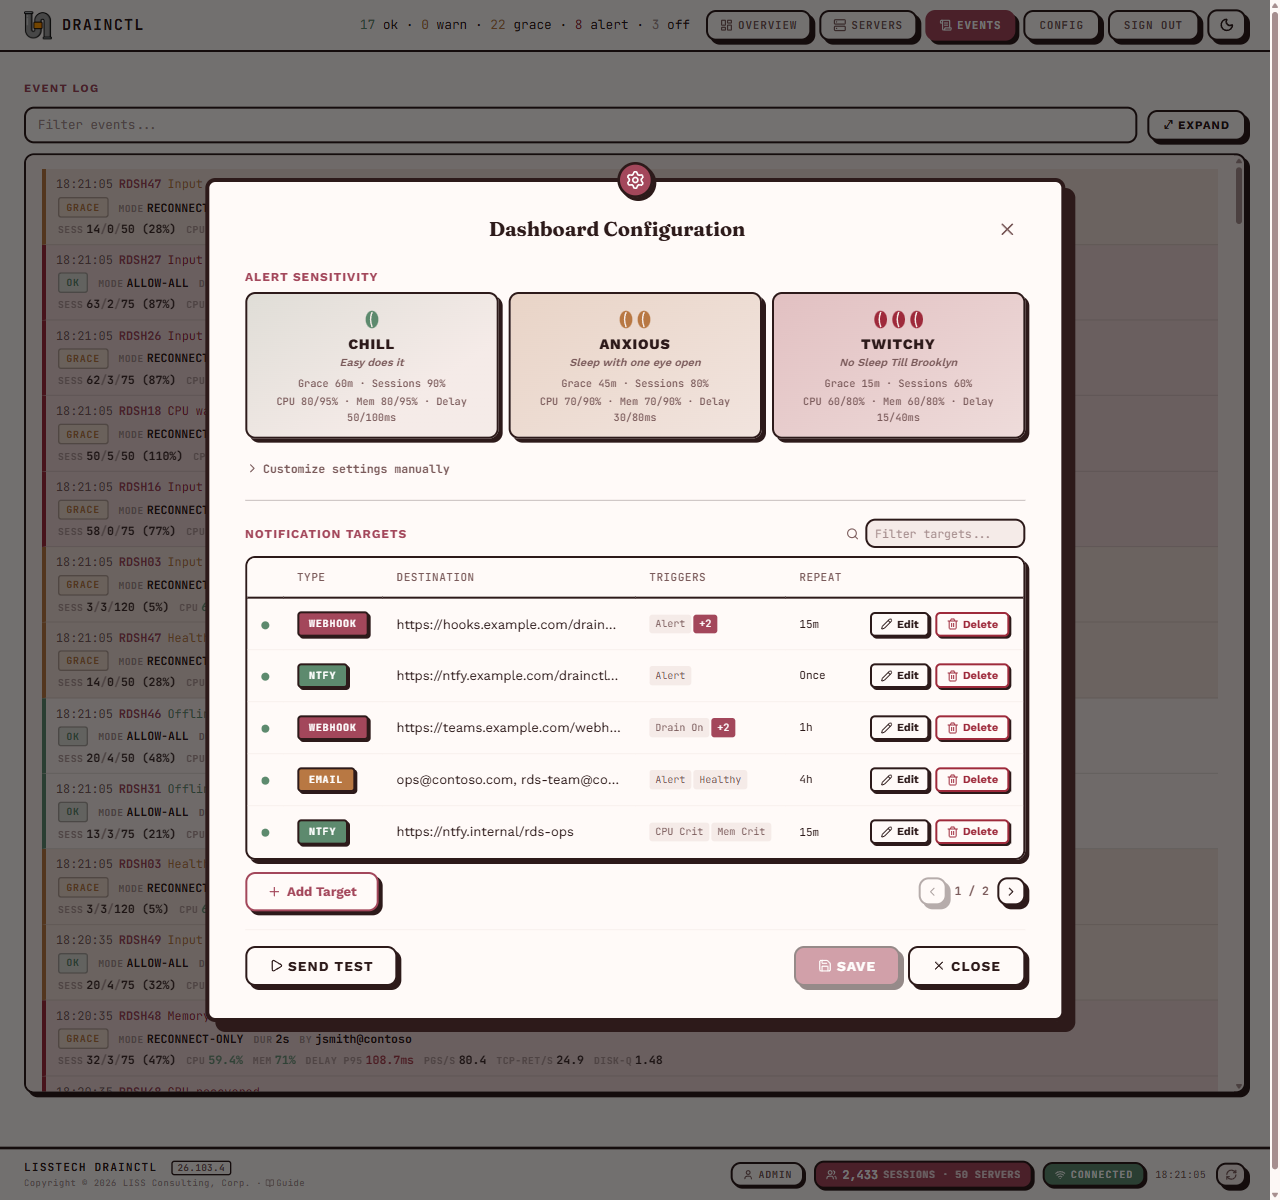
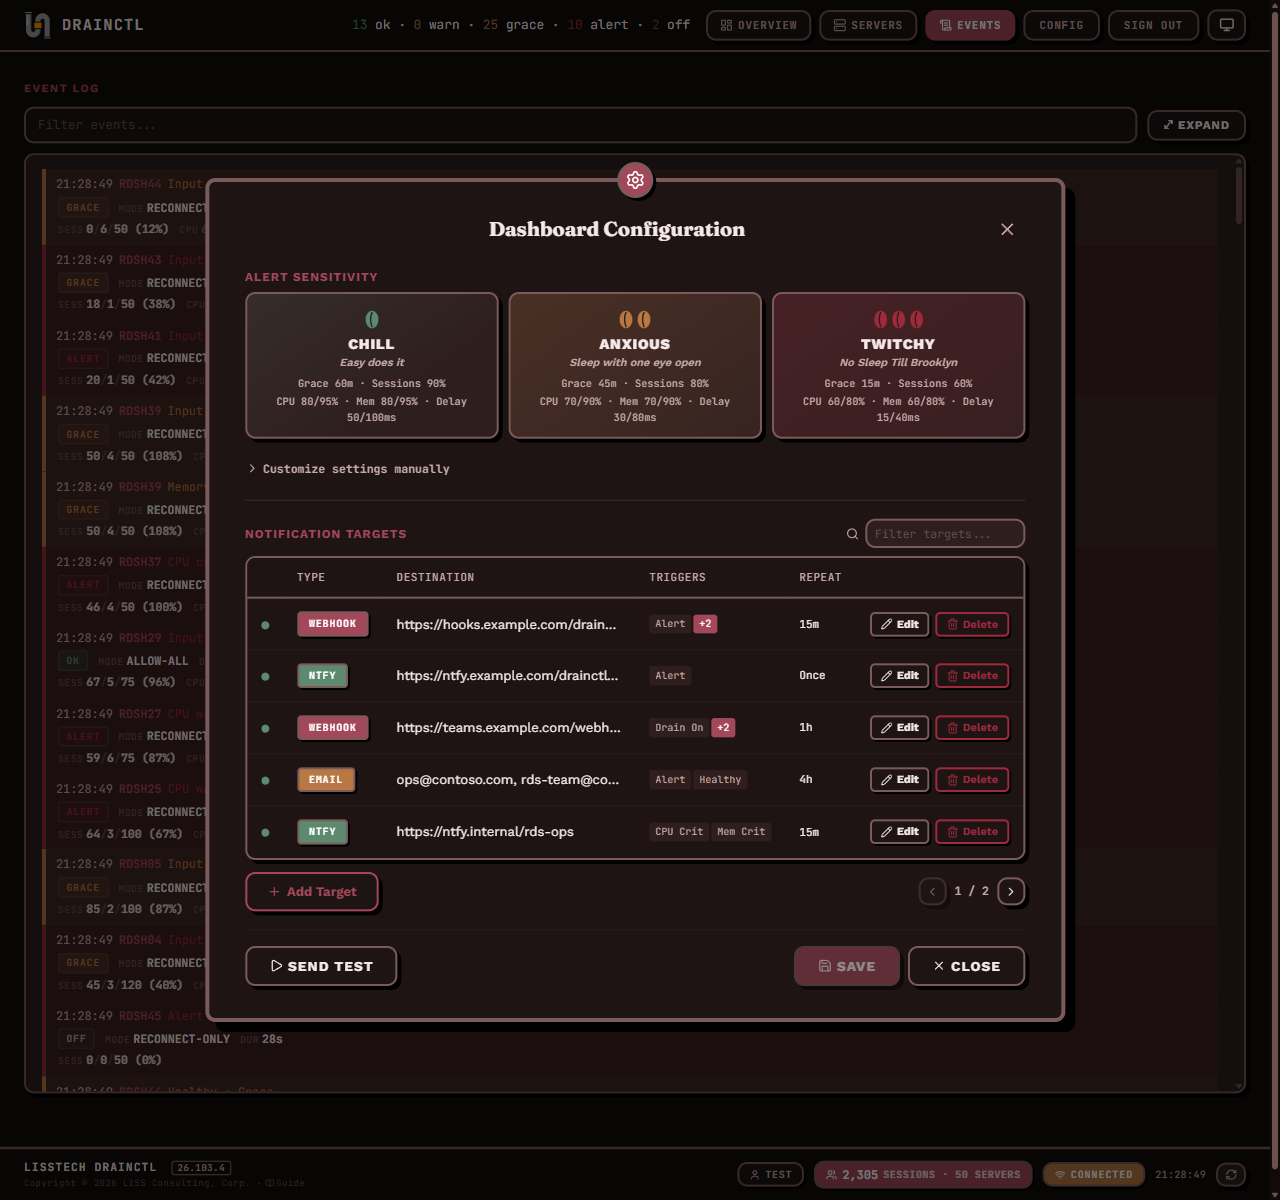
DrainCtl monitors every session host in your RDS farm — drain mode changes, active sessions, CPU, memory, input delay. One service, one dashboard, instant alerts. The change, who made it, and how long ago.

irm https://lissconsulting.github.io/LISSTech.DrainCtl/install.ps1 | iex
<1s
Detection time
365d
Default audit retention
12
Trigger types
3
Webhook + ntfy + Email
Kerberos auth
Running in production

PowerShell scripts don't call you at 2 AM.

Every RDSH admin has been there: something's wrong, users are calling, and you're RDP-ing into servers one at a time to find out who put what into drain mode and when.
The old way

PowerShell scripts

You've got a script. It polls every 5 minutes. Maybe it emails you. But it doesn't know who changed it, it can't attribute events to a user account, and the last thing you need is another fragile cron job to maintain.

DrainCtl uses kernel-level registry notifications — zero polling delay, built-in attribution via Windows Security Events.
The old way

Manual checking

Log into each server. Run chglogon /query. Check 8 hosts. Repeat. You're always the last to know — and there's no record of how long the server was drained or who was responsible.

One dashboard for your entire farm. Instant detection. SQLite-backed audit trail with timestamps, durations, and who did it.
The old way

Generic monitoring

PRTG, Zabbix, and your RMM don't understand RDSH drain semantics. They'll alert on everything or nothing, and you'll spend more time tuning thresholds than managing your farm.

DrainCtl speaks RDSH natively — it knows a 5-minute maintenance drain from a forgotten overnight drain, and tells you exactly who to call.

Complete visibility for your RDS farm.

Drain mode, sessions, CPU, memory, input delay — one service monitors everything. One dashboard shows it all. Alerts reach you by webhook, ntfy, or email before users notice.
Instant Detection
The moment someone runs chglogon /drain, the service knows. No polling delay — Windows notifies DrainCtl directly through the kernel.
👤
Who Changed It
DrainCtl tells you the exact user account that enabled drain mode. Not just that it changed — who did it, and when.
📈
Performance Monitoring
CPU, memory, disk I/O, input delay, and optional RemoteFX — collected on the configured sample interval through the Windows PDH API. Threshold alerts fire before users notice.
🌐
Farm Dashboard
One page for your entire RDSH farm. Live status, session gauges, state history chart, and event log — secured with Kerberos SSO.
📊
Session Tracking
Active and disconnected sessions on every server. Capacity threshold alerts before your farm runs out of slots.
🔔
Smart Alerts
13 trigger types across drain mode, sessions, CPU, memory, input delay, and event spikes. Webhook, ntfy, and email (SMTP) with per-target intervals.
🎯
Anomaly Detection
Opt-in evtspike learns a per-channel baseline across 54 Windows event logs. Catches what fixed thresholds miss — without false-positive noise.
📋
SQLite Audit Trail
Every state change logged with timestamps, durations, and attribution. CLI, PowerShell, or dashboard.
💾
Tiered SQLite Telemetry
Raw samples roll up to 5-minute and hourly tiers with per-tier retention. Per-host and fleet-wide queries — same store powers every chart.
📈
Fleet & Host Charts
Dual-axis LOAD, Health Indicators, Sessions, and optional RemoteFX panels on Overview — plus a per-host LOAD chart on every Server Detail with shared zoom presets.
⚙️
Dashboard-Authoritative Config
Configure thresholds and notifications once. Every agent pulls the same config — 50 servers, one source of truth.
🔒
Enterprise Ready
DNS SRV discovery, EV code-signed installer, Kerberos SSO, daily log rotation, 12 PowerShell cmdlets, and CLI.

From download to monitoring in under 3 minutes.

Three steps on the dashboard server. Session hosts discover it automatically via DNS SRV — no per-machine config.
01

Install

Run the MSI on your dashboard server with the interactive wizard, or use PowerShell for silent RMM deployment.

irm https://lissconsulting.github.io/LISSTech.DrainCtl/install.ps1 | iex
02

Add one DNS SRV record

Point your internal DNS at the dashboard host. Every session host finds it on its own — no scripts, no URLs pushed to machines.

_drainctl._tcp.contoso.com → your-dashboard-host:49470
03

Done.

Agents self-register. The dashboard shows every server. Drain changes alert in under a second. Edit thresholds and notifications once in the UI — the dashboard is authoritative, every agent pulls the same config on reload.

Built for production RDSH farms.

Meanwhile, in the server room…
🔍

Zero-Touch Discovery

One DNS SRV record. Every agent finds the dashboard on its own. No scripts, no per-machine config, no manual URLs.

_drainctl._tcp.contoso.com
The lock clicks shut…
🔒

HTTPS
Everywhere

Auto TLS on first start. Self-signed cert, or bring your own. Certificate pinning. HSTS. Private key locked to SYSTEM.

At the notification desk…
📧

Email + Webhook + ntfy

SMTP email with HTML templates and natural-language subjects. Webhook and ntfy.sh too. Manage all targets from the dashboard with per-target triggers.

The counters are watching…
📈

Performance Monitoring

CPU, memory, input delay, disk I/O, and optional RemoteFX — collected via PDH on the configured sample interval. Threshold alerts fire before users complain.

The cmdlets assemble…

12 Cmdlets

Add-, Get-, Remove-RDSHDrainNotificationTarget. Full multi-target control from PowerShell.

The installer arrives…
📦

MSI with Superpowers

Interactive wizard or silent deploy. INSTALL_MODE=dashboard, DASHBOARD_URL=..., ENABLE_PERF=1 — configure machine-owned settings from the command line. Upgrades skip config dialogs and preserve existing settings.

Current build — retained charts, signed updates, cleaner service lifetimes.

  • SQLite-backed dashboard history. Overview charts and per-host sparklines now cold-start from retained telemetry, not browser-local samples.
  • Signed auto-updates. The updater verifies the MSI signature and a release manifest bound to the MSI SHA-256.
  • Prerelease-safe installer. The one-line installer now falls back to the newest prerelease when no stable GitHub release exists.
  • LCI service migration. Dashboard, watchers, pipe server, logging, selfmetrics, pprof, spike forwarding, and registration workers now have bounded start/stop lifetimes.
  • Retained chart windows. Fleet LOAD, Health Indicators, Sessions, RemoteFX, host LOAD, and event-spike swimlanes share the 5M / 1H / 1D / 3D / 5D vocabulary.
  • Hardened secrets and access. DPAPI-protected notification secrets, stricter config ACLs, and admin-gated privileged pipe verbs.
All releases →

One dashboard for your entire RDSH farm.

See every server's drain state, session count, and alert history on a single page. Configure notifications and thresholds once — every agent in the farm inherits them. Enable the dashboard, add one DNS SRV record, done.
🔌

One Command Setup

drainctl dashboard enable, add one DNS SRV record, done. Agents discover and register themselves.

🔒

Secure by Default

Auto TLS, Kerberos SSO or credential login, certificate pinning, HSTS. Session-based auth with 8-hour timeout.

📈

Live Monitoring

Real-time updates via Server-Sent Events. LOAD, Health Indicators, Session, and optional RemoteFX panels query retained SQLite telemetry; every Server Detail has a durable host LOAD chart with shared zoom presets.

⚙️

Edit Config in the UI

Notification targets, grace periods, session thresholds, performance settings, and the evtspike enable switch are edited from the dashboard. Agents pull the authoritative config on their normal fetch cadence.

How it detects changes in real time

Four detection mechanisms feed a single service — no agents to install, no polling gaps, no missed changes.

Registry Watch

Fires the instant drain mode changes. No polling — the OS notifies the service directly.

~0ms

Event Log Audit

Security Event 4657 tells you who made the change. Attribution you can't get from registry monitoring alone.

Who did it

Performance Counters

CPU, memory, input delay, disk queue, TCP retransmits, and optional RemoteFX metrics. Configurable sustain windows filter transient spikes.

CPU + Mem + Delay

Notifications

Webhook, ntfy, and email with per-target triggers and repeat intervals. DPAPI-encrypted secrets at rest.

3 channels

CLI, PowerShell, or both.

Every interface returns the same data. Pick the one that fits your workflow.
# Check drain mode status (instant via service pipe)
PS> drainctl check
2026-04-02T20:08:56-04:00 [INF] source=service
2026-04-02T20:08:56-04:00 [INF] host=MDS-LDC1-RDS5
2026-04-02T20:08:56-04:00 [INF] drain_mode=ALLOW_ALL_CONNECTIONS value=0
2026-04-02T20:08:56-04:00 [INF] state_since=2026-04-02T18:30:00-04:00 state_duration=1h38m56s
2026-04-02T20:08:56-04:00 [INF] grace_period=1h0m0s
2026-04-02T20:08:56-04:00 [OK ] status=Healthy connections_allowed=true exit=0

# When drain mode is active beyond grace period:
2026-04-02T22:15:00-04:00 [ERR] status=Alert connections_allowed=false exit=1
# Exit code 1 triggers your RMM monitoring threshold
# Rich status object
PS> Get-RDSHDrainMode

Timestamp            : 4/2/2026 8:08:56 PM
Host                 : MDS-LDC1-RDS5
DrainMode            : ALLOW_ALL_CONNECTIONS
StateSince           : 4/2/2026 6:30:00 PM
StateDurationSeconds : 5936
Status               : Healthy
ConnectionsAllowed   : True
Message              : All connections allowed.
ExitCode             : 0

# Boolean check for scripts and alerts
PS> if (Test-RDSHDrainMode) { "OK" } else { "ALERT" }
OK

# One-liner for monitoring scripts
PS> (Get-RDSHDrainMode).Status
Healthy
# Machine-readable output for automation
PS> drainctl check --format json
{
  "version": "26.119.10",
  "host": "MDS-LDC1-RDS5",
  "drain_mode": "ALLOW_ALL_CONNECTIONS",
  "drain_mode_value": 0,
  "state_since": "2026-04-02T18:30:00-04:00",
  "state_duration_seconds": 5936.42,
  "grace_period_seconds": 3600,
  "status": "Healthy",
  "connections_allowed": true,
  "sessions": {
    "active_sessions": 12,
    "disconnected_sessions": 3,
    "total_sessions": 15,
    "max_sessions": 25,
    "utilization_pct": 60
  },
  "message": "All connections allowed.",
  "exit_code": 0
}
# View recent state transitions with attribution
PS> Get-RDSHDrainHistory -ChangesOnly -Limit 5

Timestamp              DrainMode                             Changed  ChangedBy         Exit
---------              ---------                             -------  ---------         ----
4/2/2026 10:14:04 PM   ALLOW_RECONNECTIONS_PREVENT_NEW..     YES      MDS\lissadmin     0
4/2/2026 10:13:32 PM   ALLOW_ALL_CONNECTIONS                 YES      MDS\lissadmin     0
4/2/2026 10:10:00 PM   ALLOW_RECONNECTIONS_PREVENT_NEW..     YES      MDS\lissadmin     0
4/2/2026  8:30:00 PM   ALLOW_ALL_CONNECTIONS                 YES      MDS\svcaccount    0
4/2/2026  6:15:00 PM   ALLOW_RECONNECTIONS_PREVENT_NEW..     YES      MDS\jdoe          0

# Filter in pipeline
PS> Get-RDSHDrainHistory | Where-Object Changed | Select Timestamp, ChangedBy

Pick your path

All roads lead to monitoring. Full guide →
Fleet deploy

Silent MSI

Same MSI for RMM, SCCM, Intune, or GPO deployment. No UI — configure everything via properties.

msiexec /i LISSTech.DrainCtl.msi /qn
Module only

PowerShell Gallery

Just the cmdlets — no service, no CLI. Good for quick checks and scripts. Public builds are currently prerelease; use -AllowPrerelease when needed.

Install-Module LISSTech.DrainCtl -AllowPrerelease
“We monitor 14 session hosts across 3 client sites. Before DrainCtl, we'd find out someone drained a server when users started calling. Now we know before they do.”

— MDS Production Environment, LISS Technologies

Built by people who manage RDSH farms every day.

LISS Technologies is a NYC-based managed services provider — in business since 1984. We manage Windows infrastructure, RDSH farms, and enterprise environments for our clients.

DrainCtl exists because we needed it. No tool on the market gave us instant drain detection with proper attribution, a farm-wide dashboard, and alerts that understood RDSH semantics — so we built one. It's been running in production at client sites since before this page existed.

We open-source the tools we'd want to use ourselves. If your team manages session hosts, you're the kind of shop we work with.

Track record

NYC-based MSP since 1984. Four decades of enterprise Windows infrastructure management.

Dogfooded first

Every tool we release is running in production at a client site before it ships publicly. DrainCtl monitors live RDSH farms daily.

Open source, no strings

Apache 2.0. Fork it, deploy it, modify it. We release tools we'd want to exist — not lead-generation demos.